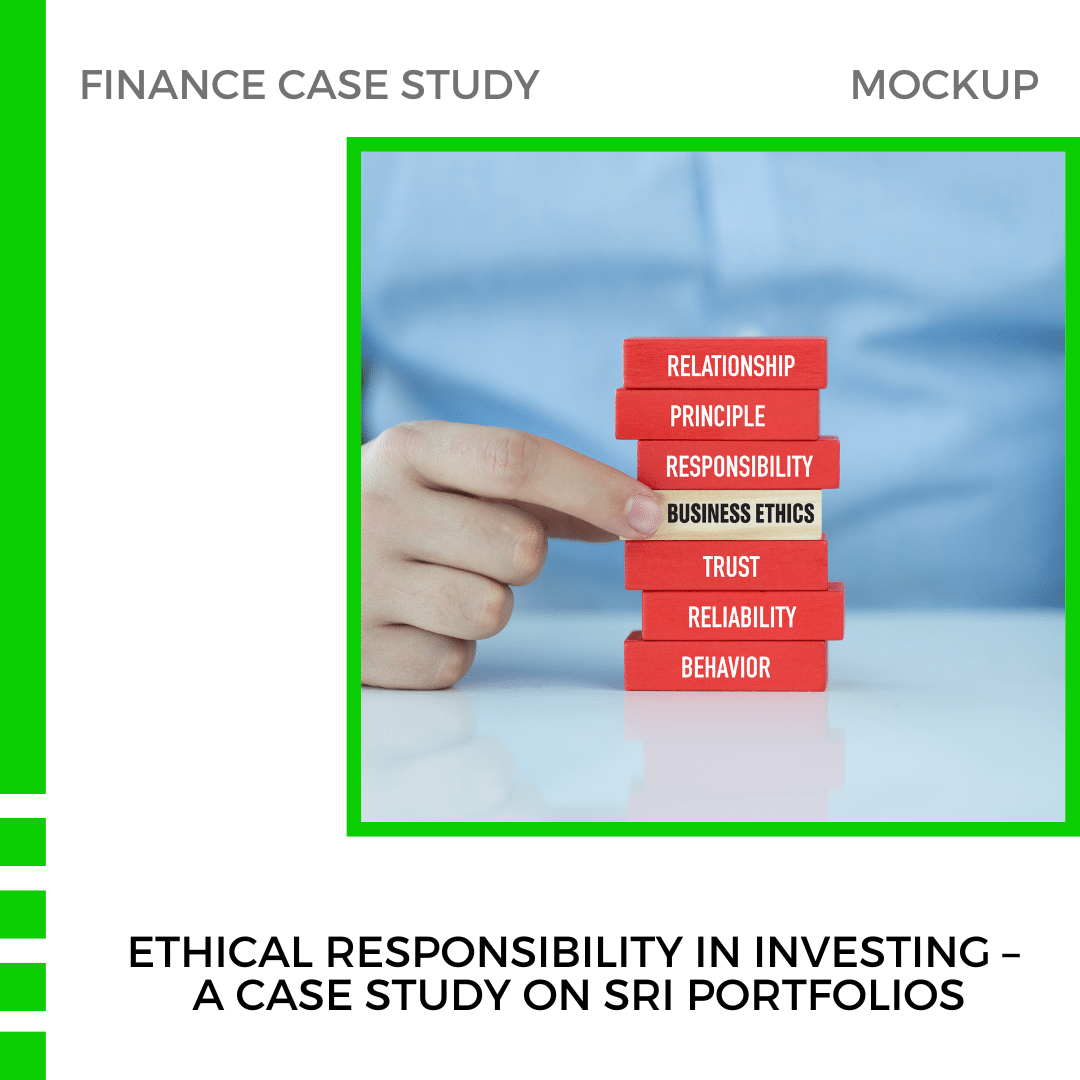
Ethical Responsibility in Investing – A Case Study on SRI Portfolios
Introduction
Ethical Responsibility in investing, also known as socially responsible investing (SRI), seeks to balance financial gains with positive societal outcomes. SRI uses environmental, social, and governance (ESG) principles to guide investment decisions. This case study explores how SRI portfolios perform compared to traditional and hybrid portfolios, analyzing financial performance, risk factors, and social impact. Explore how Ethical Responsibility influences investment strategies with insights into SRI vs traditional portfolios. Learn the advantages, risks, and future trends.
Objectives
- Understand the concept of ethical responsibility in investing.
- Analyze the financial performance and risks associated with SRI portfolios versus traditional investments.
- Evaluate the social and environmental impact of different portfolios.
- Discuss the trade-offs and benefits of incorporating ethical responsibility into investments.
Background Information
Key Concepts
- Ethical Investing: Involves avoiding companies engaged in unethical activities (e.g., environmental harm).
- SRI Investing: Focuses on investments that align with ESG standards.
- Traditional Investing: Prioritizes financial returns, disregarding social or ecological factors.
Key Financial Metrics
- Return on Investment (ROI): Measures profitability.
- Standard Deviation: Represents the risk or volatility.
- Sharpe Ratio: Calculates return adjusted for risk.
- Beta: Measures a portfolio’s volatility compared to the market.
Portfolio Analysis
Portfolio 1: Ethical/SRI Portfolio
Composition:
- 30% Renewable energy companies
- 20% of Companies with solid labour practices
- 20% Low-carbon footprint companies
- 20% Diversity and inclusion-focused companies
- 10% Community development financial institutions
Performance Metrics:
- ROI: 8% per annum
- Standard Deviation: 10%
- Sharpe Ratio: 0.6
- Beta: 0.8
Portfolio 2: Traditional Portfolio
Composition:
- 40% Large-cap technology stocks
- 30% Large-cap financial stocks
- 20% Blue-chip industrial companies
- 10% Government bonds
Performance Metrics:
- ROI: 10% per annum
- Standard Deviation: 12%
- Sharpe Ratio: 0.7
- Beta: 1.0
Portfolio 3: Balanced Portfolio (Hybrid)
Composition:
- 20% Renewable energy companies
- 20% of Companies with solid labour practices
- 30% Large-cap technology stocks
- 20% Blue-chip industrial companies
- 10% Government bonds
Performance Metrics:
- ROI: 9% per annum
- Standard Deviation: 11%
- Sharpe Ratio: 0.65
- Beta: 0.9
Case Study Analysis
Task 1: Compare Financial Performance
The Traditional Portfolio offers the highest ROI (10%), but the Ethical/SRI Portfolio shows more stability, with a lower % standard deviation of 10%. This indicates that while SRI portfolios may lag in returns, they carry lower risk, making them attractive for risk-averse investors.
Task 2: Analyze Risk Profiles
- Ethical/SRI Portfolio: Lower risk (Beta 0.8) with moderate returns.
- Traditional Portfolio: Higher volatility (Beta 1.0), but better ROI.
- Balanced Portfolio: Offers a mix, with a Beta of 0.9 and moderate returns.
Task 3: Social Impact Assessment
SRI portfolios focus on renewable energy, labour rights, and diversity. In contrast, the Traditional Portfolio may include companies contributing to carbon emissions or exploiting labour.
Task 4: Discuss Advantages and Disadvantages
1. Ethical/SRI Investing
Advantages:
- Promotes positive social change
- Aligns with personal values
- Supports long-term sustainability
Disadvantages:
- May yield lower returns
- Limited investment choices
- Requires higher research efforts
2. Traditional Investing
Advantages:
- Maximizes financial returns
- It provides a broader range of options
- Involves lower research costs
Disadvantages:
- Potential for negative social impacts
- It may not align with ethical principles
3. Balanced Investing
Advantages:
- Combines profitability with ethical responsibility
- Offers diversified risks
Disadvantages:
- Might not fully meet ethical goals
- Moderate financial returns
Financial Statements for Analysis
Ethical/SRI Portfolio
| Metric | Amount |
|---|---|
| ROI | 8% per annum |
| Standard Deviation | 10% |
| Sharpe Ratio | 0.6 |
| Beta | 0.8 |
Traditional Portfolio
| Metric | Amount |
|---|---|
| ROI | 10% per annum |
| Standard Deviation | 12% |
| Sharpe Ratio | 0.7 |
| Beta | 1.0 |
Balanced Portfolio (Hybrid)
| Metric | Amount |
|---|---|
| ROI | 9% per annum |
| Standard Deviation | 11% |
| Sharpe Ratio | 0.65 |
| Beta | 0.9 |
Long-Term Performance Considerations
Historical Performance
SRI strategies have consistently grown over the past decade, driven by regulatory support and consumer awareness. However, they still underperform compared to traditional portfolios in specific high-growth sectors like technology.
Future Outlook
SRI is expected to gain momentum, particularly with growing concerns about climate change and labour practices. Future risks include regulatory shifts and potential greenwashing. Traditional portfolios may continue outperforming in the short term, but SRI offers resilience against long-term risks.
Proposed Solution
Investors should adopt a hybrid strategy to achieve the optimal balance between returns and ethical responsibility. This Balanced Portfolio provides the flexibility to earn competitive returns while making a positive social impact. Investors can further enhance performance by rebalancing portfolios periodically, focusing on emerging ESG sectors like clean technology. As consumers become more aware, businesses are expected to demonstrate ethical responsibility in labour practices, ensuring fair wages and safe working conditions.
Conclusion
This case study demonstrates that while Ethical Responsibility in investing may yield slightly lower returns, it offers lower volatility and long-term sustainability. The Balanced Portfolio stands out as the best solution, merging the benefits of both traditional and SRI investing. As consumer preferences evolve toward sustainability, SRI will likely become a core of mainstream investing strategies.
References
Explore Business Models of Global Companies and Indian Companies


